Facebook
 X
X
 Pinterest
 Copy Link


Will COVID-19 Impact Where People Want to Live?
Recently, Matthew Gardner, Windermere’s Chief Economist released a video about the effects COVID-19 is having and/or could have on consumer tendencies in real estate. There seems to be quite the paradigm shift happening due to health reasons, appreciating simpler schedules, and the new phenomenon of many people working from home. Along with Matthew, Leading Real Estate Companies of the World and Keeping Current Matters are reporting similar indicators due to COVID 19.
The Flight to the Suburbs: Many buyers are listing more open space and less density as one of their top features when looking for a new home. The larger yards and separation from neighbors found in the suburbs versus urban areas are appealing for health reasons, due to the need to socially distance. Higher density buildings and townhouses found in-city were more appealing due to shorter commute times, but the newfound option to work from home has encouraged some buyers to venture out and consider commute times as less of a factor when choosing where they want to live.
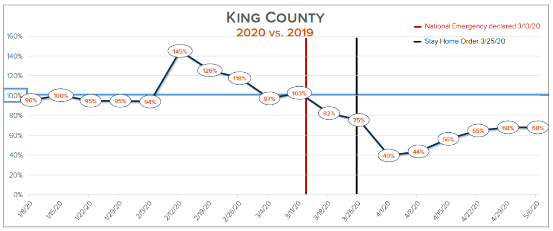
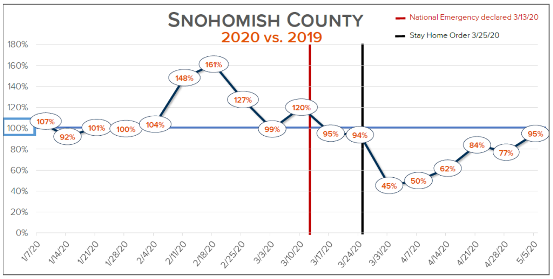
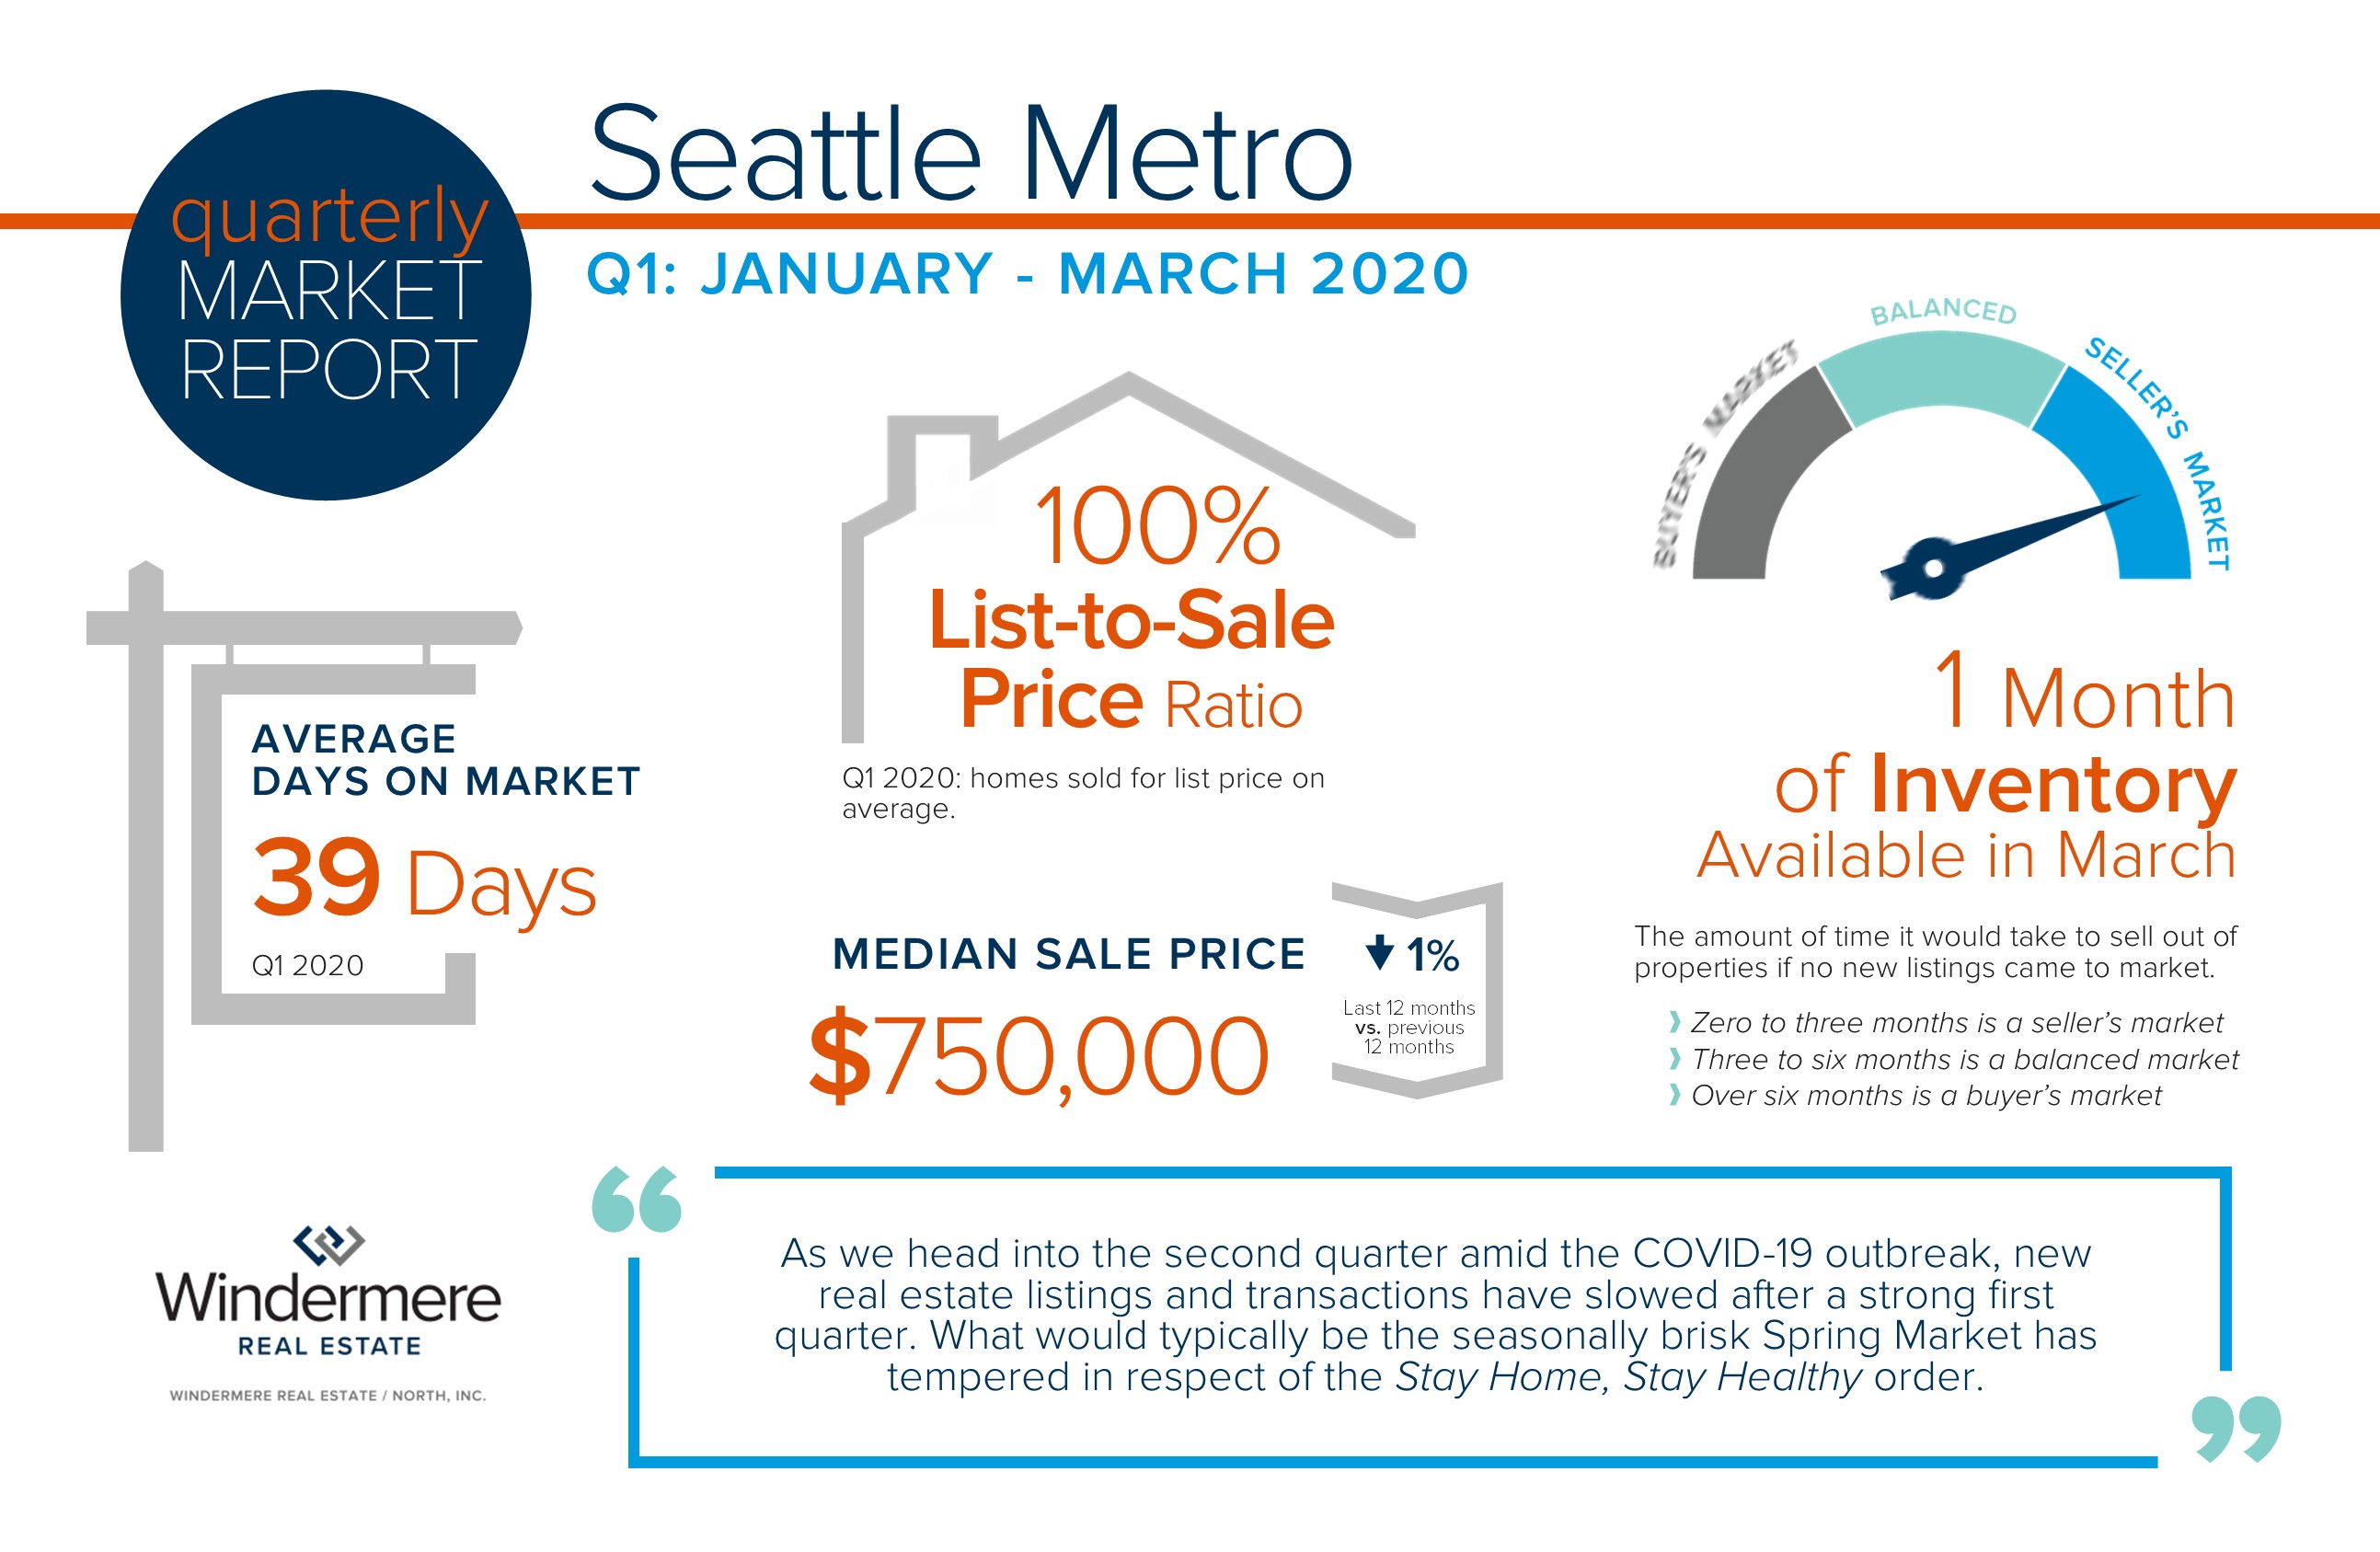
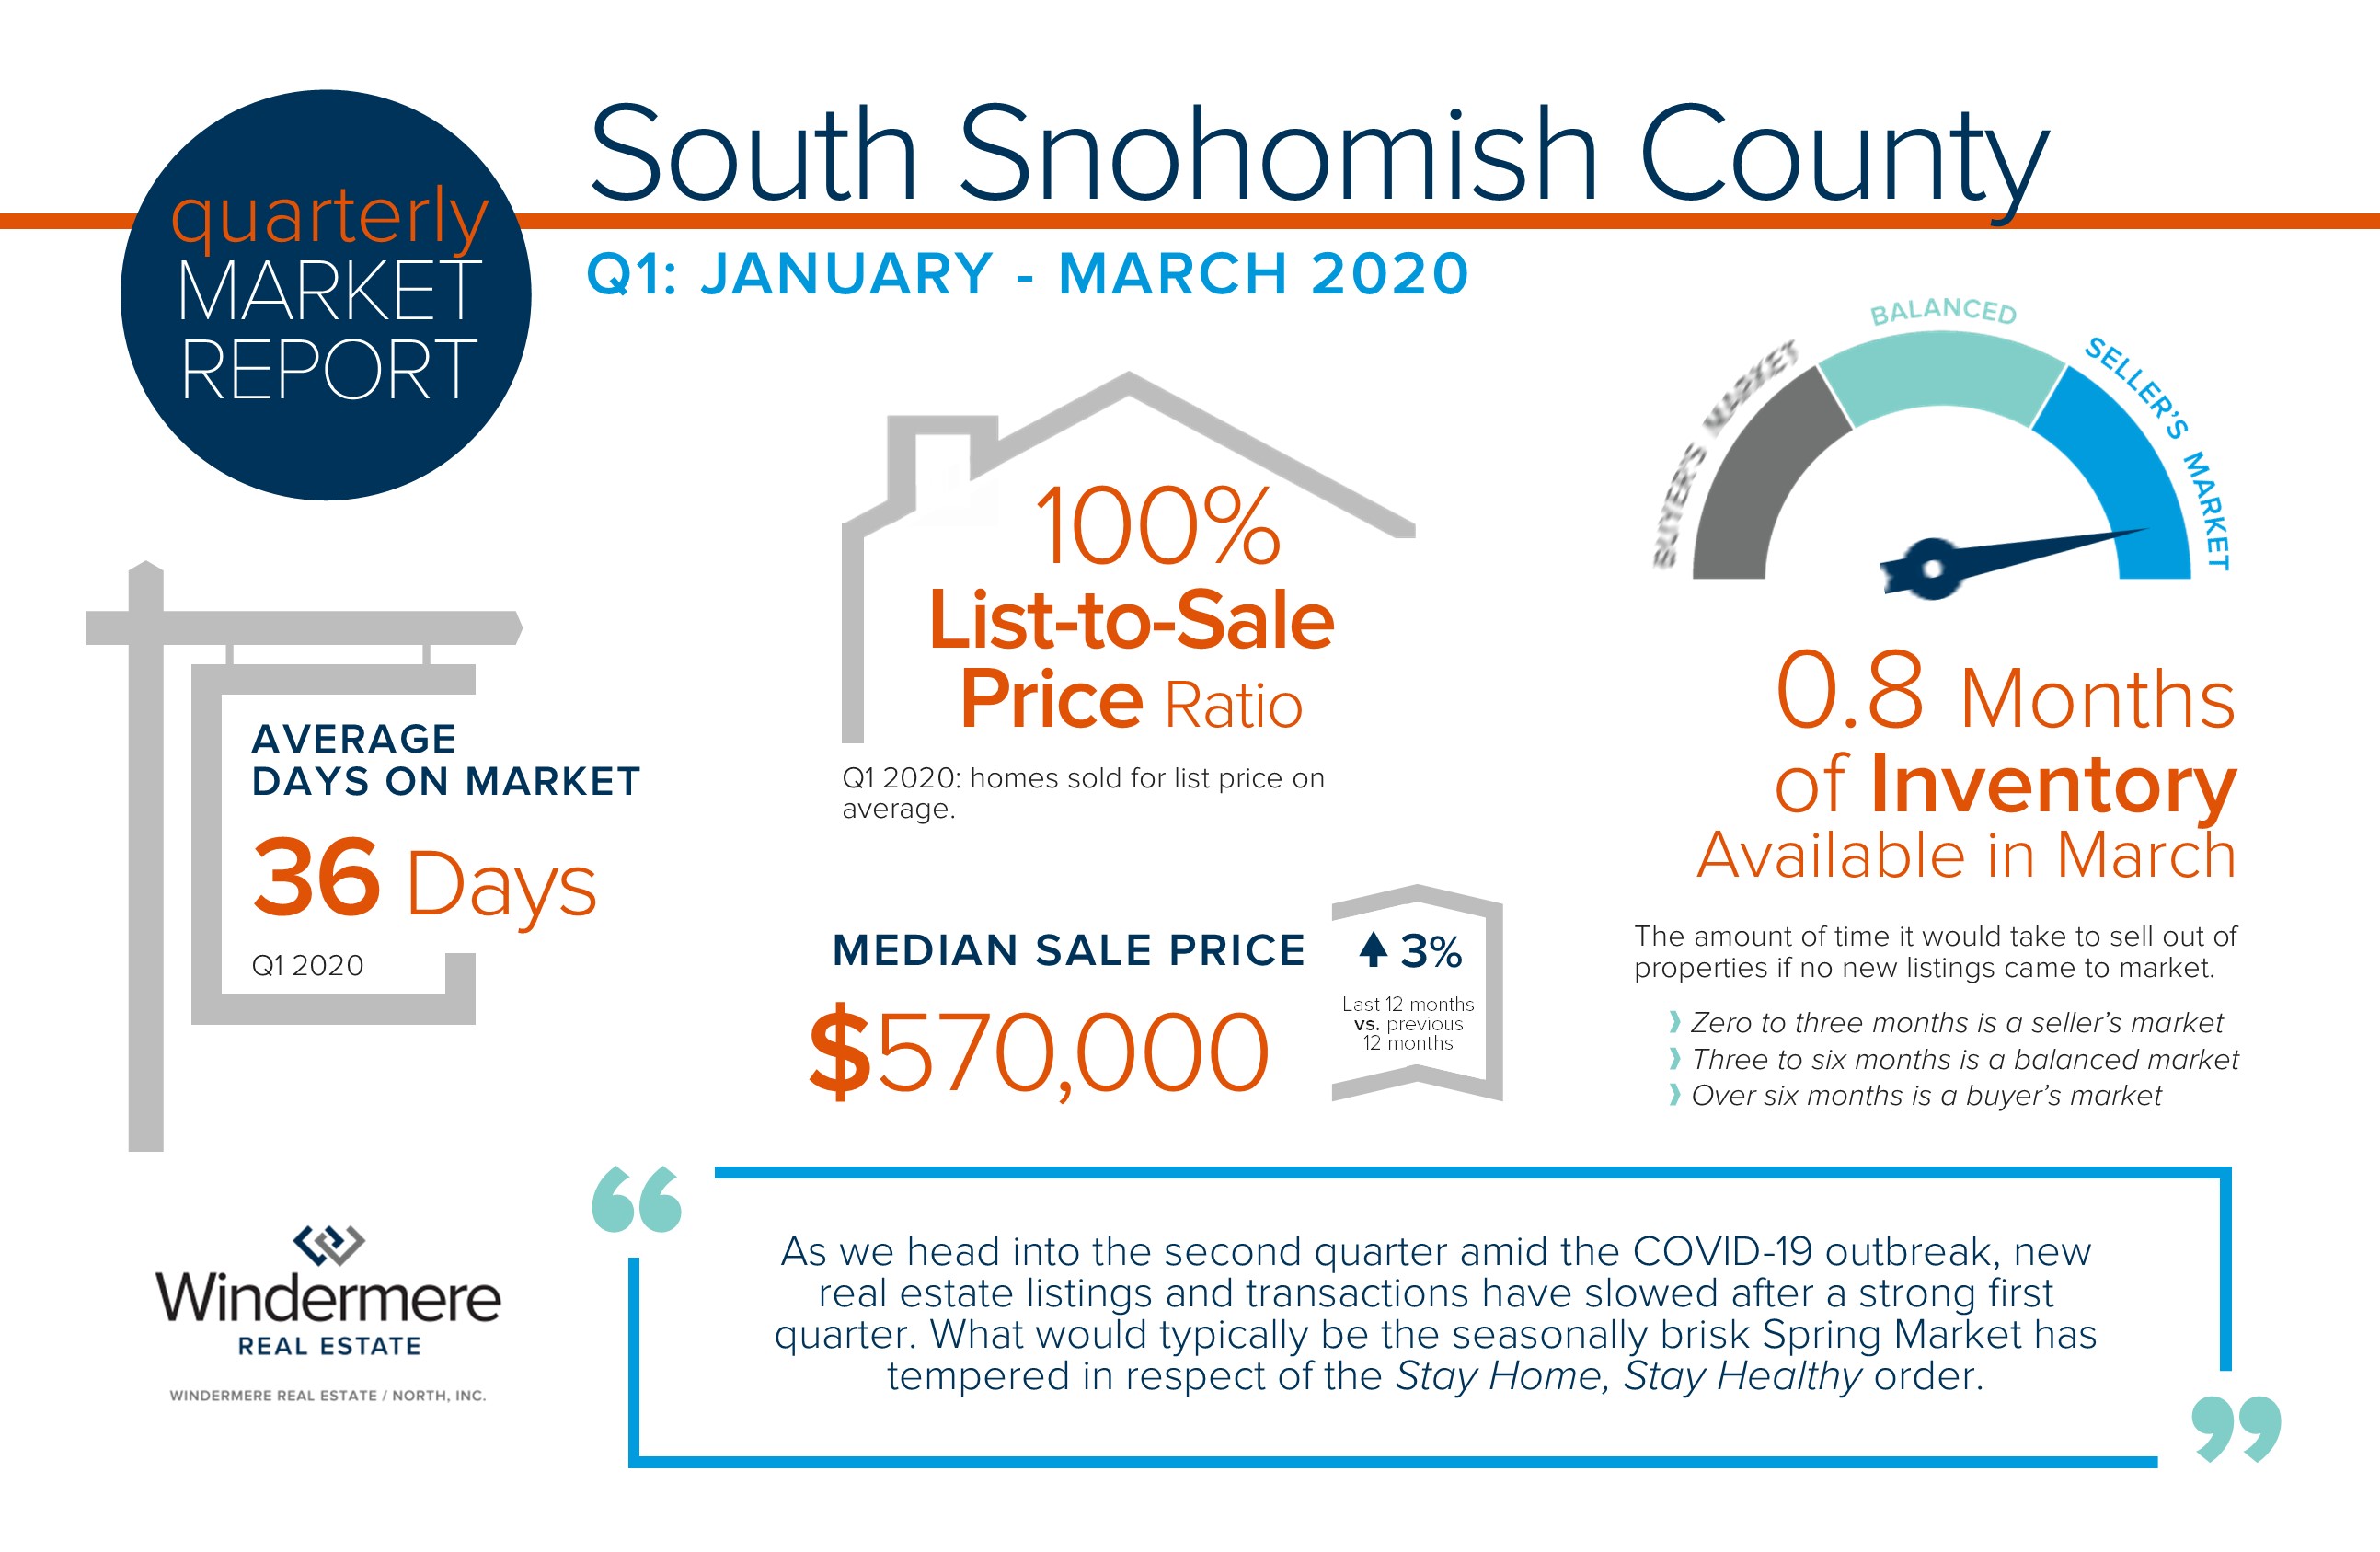
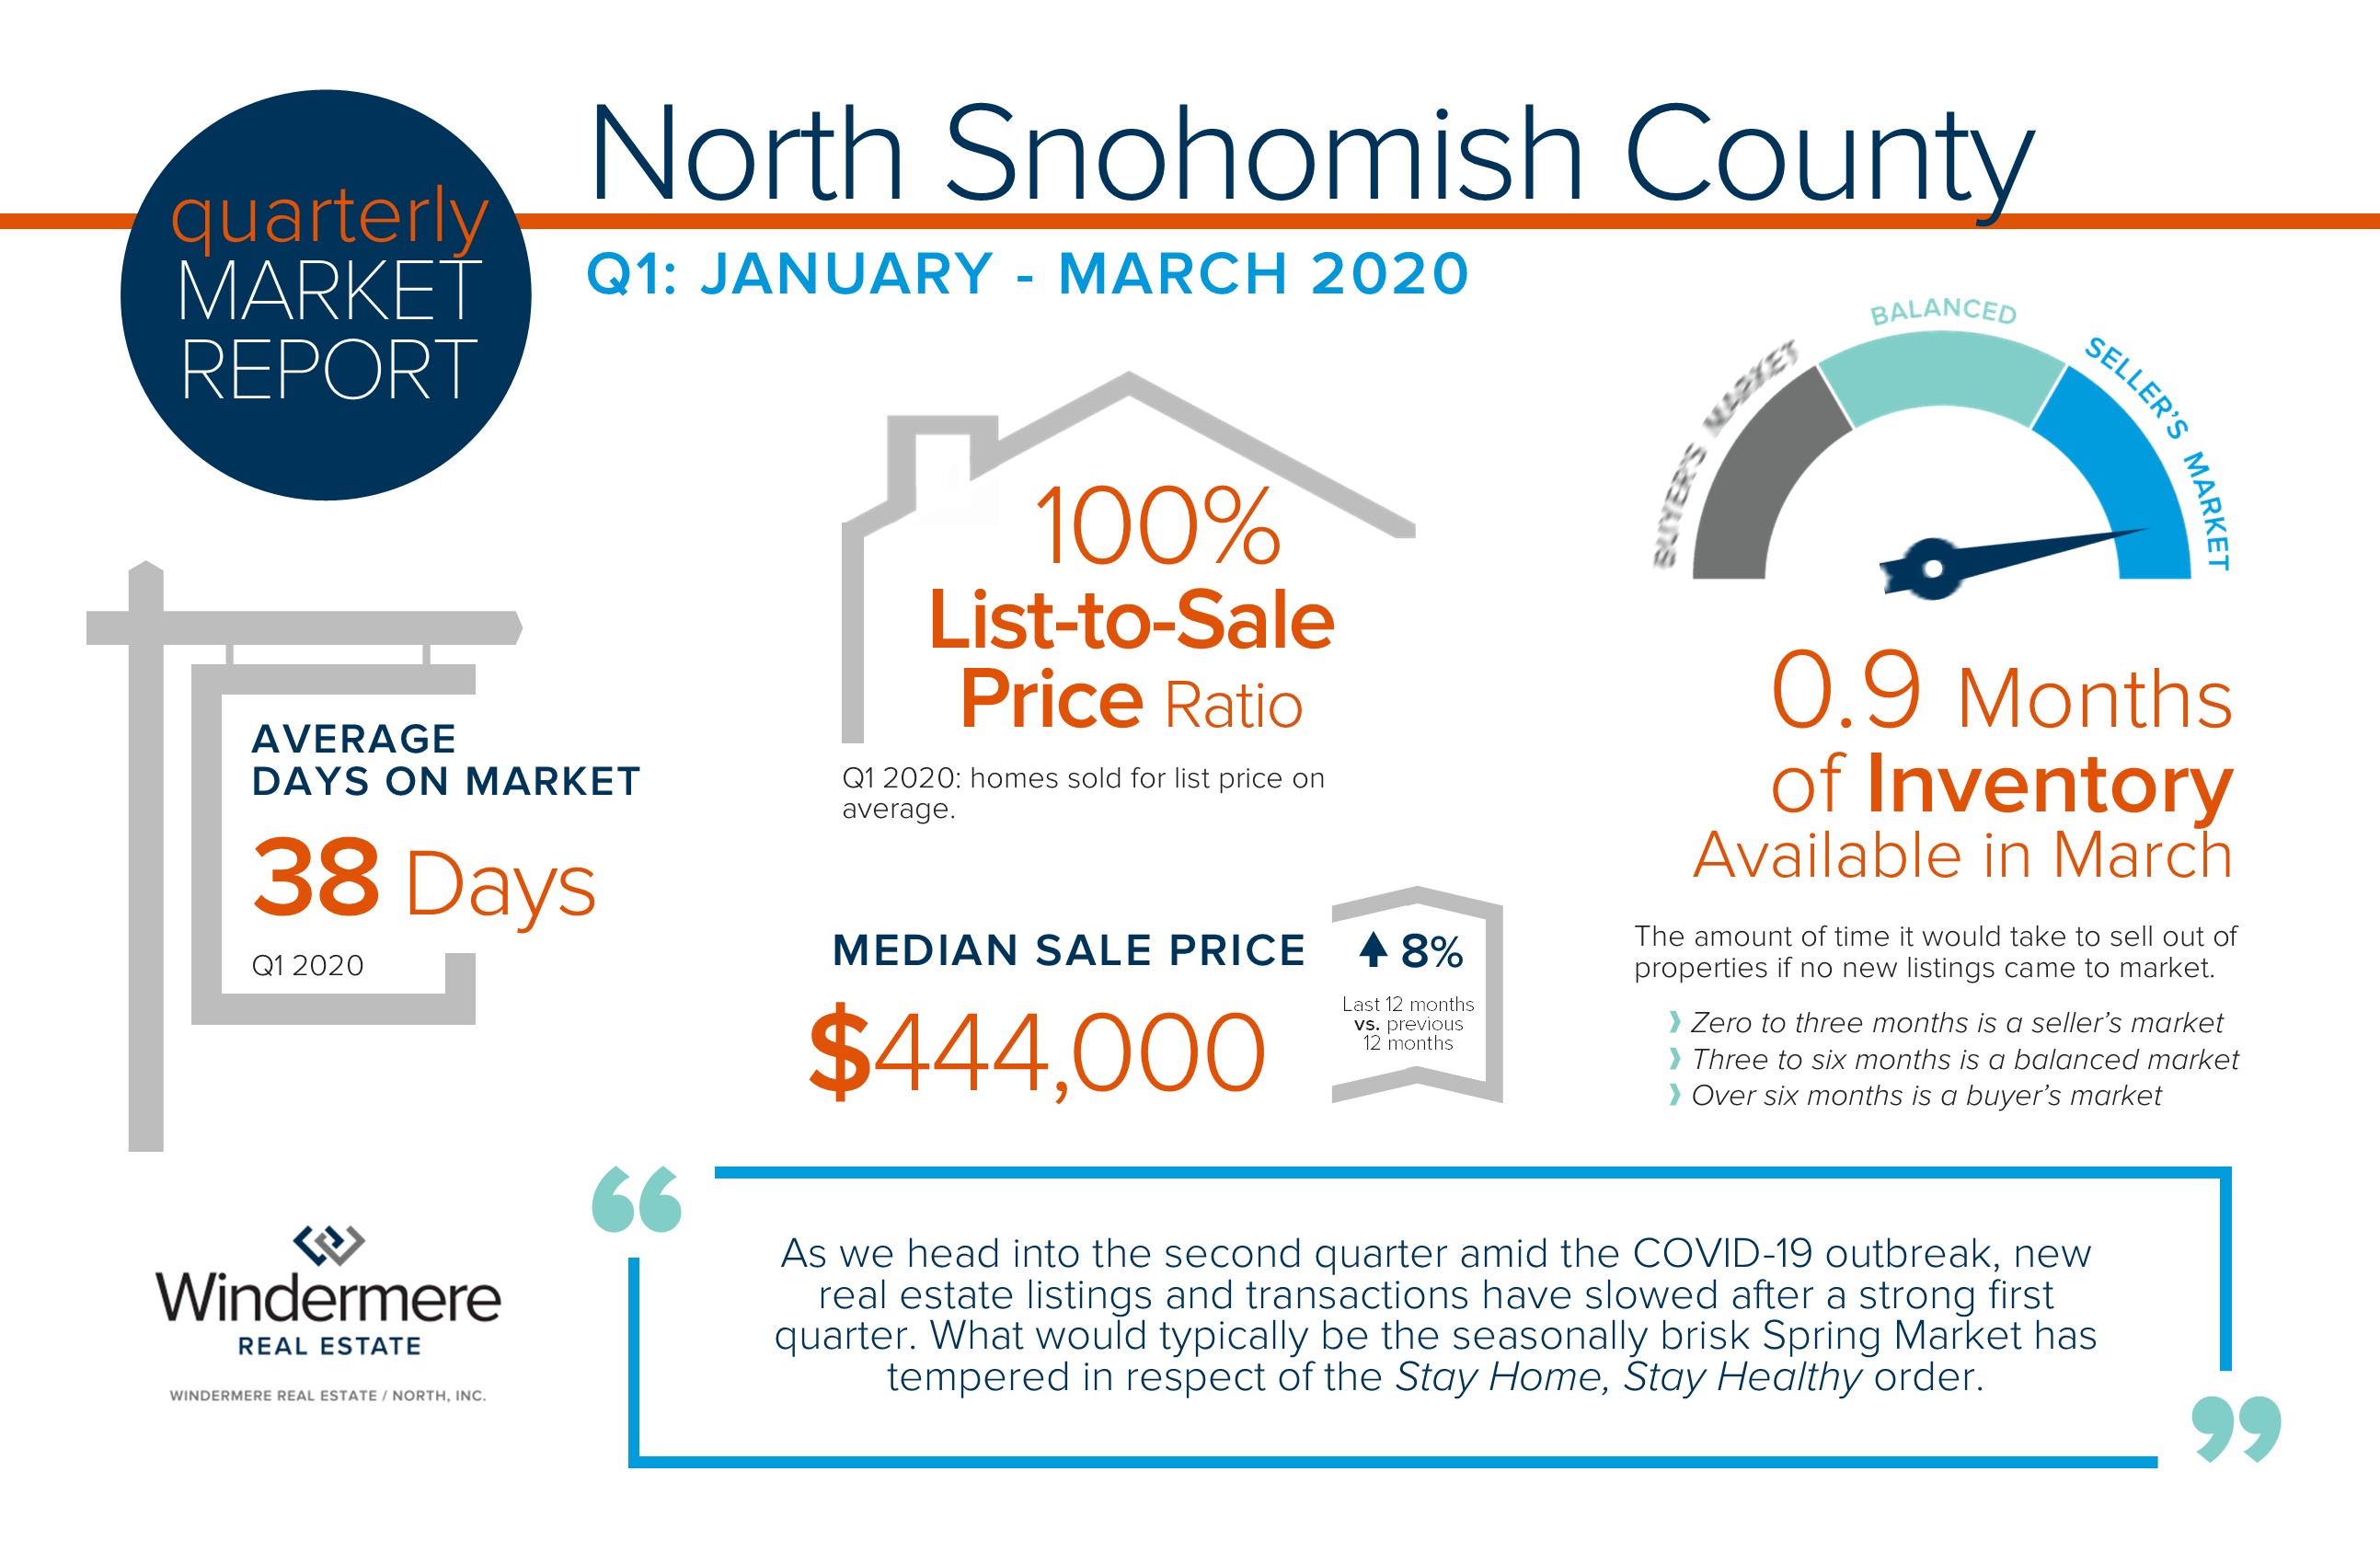
Many high-tech employers such as Amazon, Google, and Facebook have extended the work-from-home option until the end of 2020 despite the phasing to get businesses re-opened. Companies like Twitter told some employees they could work from home indefinitely. This will have some buyers in these types of jobs capitalizing on suburban living, which is typically less expensive than in-city living and includes larger homes and yards. Look at the weekly stats for both King and Snohomish counties below. This compares the number of pending sales per week this year versus the same week last year, and the more suburban and affordable area of Snohomish County is thriving!

Return of the McMansion: Millennials had already begun looking at the suburbs as they embarked on crossing the threshold of big life events such as getting married and starting a family. Now, with more people working from home and desiring more space, the larger square footage homes are becoming more appealing.
This affords more flex spaces for at-home offices, especially if more than one adult is working from home. Space to enjoy hobbies and passions such as an in-home yoga or craft studio or in-home gym are predicted to be popular. Further, private outdoor spaces are a hit, such as fire pits, play areas for children, and outdoor entertaining space which encourages recreation and distancing.
Second-Home Market Boom: With air travel severely reduced, the desire to have a second home within driving distance has increased. Many people’s commitments have simplified and their dreams have shifted to accommodate more down-time closer to home. The change of scenery a lake, beach, or mountain property provides along with space to distance is quickly becoming in-demand. The use of homes like this versus large travel budgets could make a comeback, especially if future rental income is considered. Overall, we have seen an increased value put on local access to nature to decompress and down-shift.
Single-Family Residential Rentals vs. Apartment Rentals: Again this comes back to density versus open space. Renters also desire more room, and some are also working from home, so they may opt for a single-family home over an apartment building with shared space. There could also be a push for college students to prefer renting a single-family home instead of living in a dorm, increasing the rental value of such investment properties in college towns.
Check out the video below to hear Matthew’s entire take on all of these possible changes in how and where we want to live based on COVID 19 and the life lessons were are learning as we navigate this new way of life. What I can tell you is that the real estate market is moving! Activity has seen a large uptick since the first of May, and in many areas and price points we are lacking available inventory to meet the buyer demand.
If you are curious how these new trends and the state of current real estate market relates to your personal needs and dreams, please reach out. It is my goal to help keep my clients informed and empower storing decisions, especially during these unique times. Be well!

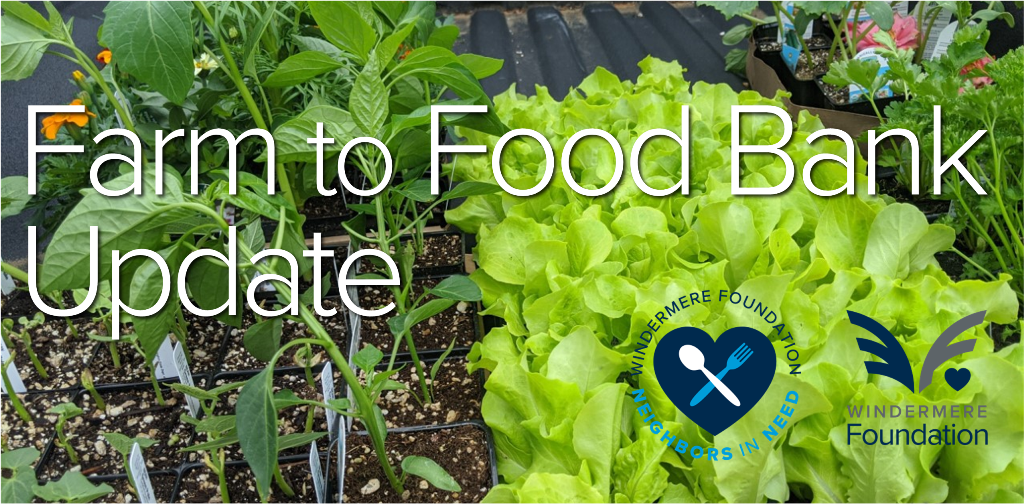
I am excited to share some updates from the Martha Perry Veggie Garden in Snohomish, WA! We have already purchased the vegetable starts to help support the Snohomish Garden Club, and have begun planting for the harvest. My office is working in socially distant groups, broken up by nine groups working over three weeks to get this acre of produce in the ground. By using starts instead of seeds we will be able to provide the harvest sooner and for longer throughout the season.
This is all possible thanks to your generosity! Our office raised $8,000 in under two weeks to benefit local food banks through our Neighbors in Need Program powered by the Windermere Foundation. A portion of that money was earmarked for this garden project and replaced our annual Community Service Day project that was done for the last four years in a large group of 50 people. This will provide local food banks with thousands of pounds of fresh produce throughout the summer and early fall and will be especially meaningful during this challenging time. Check out some of our first groups getting to work, making it possible for those in need to enjoy fresh produce instead of only non-perishable foods via the local food banks.